Dashboards & widgets
Drag-and-drop widgets, a 12-column grid, fifteen widget types and drill-down.
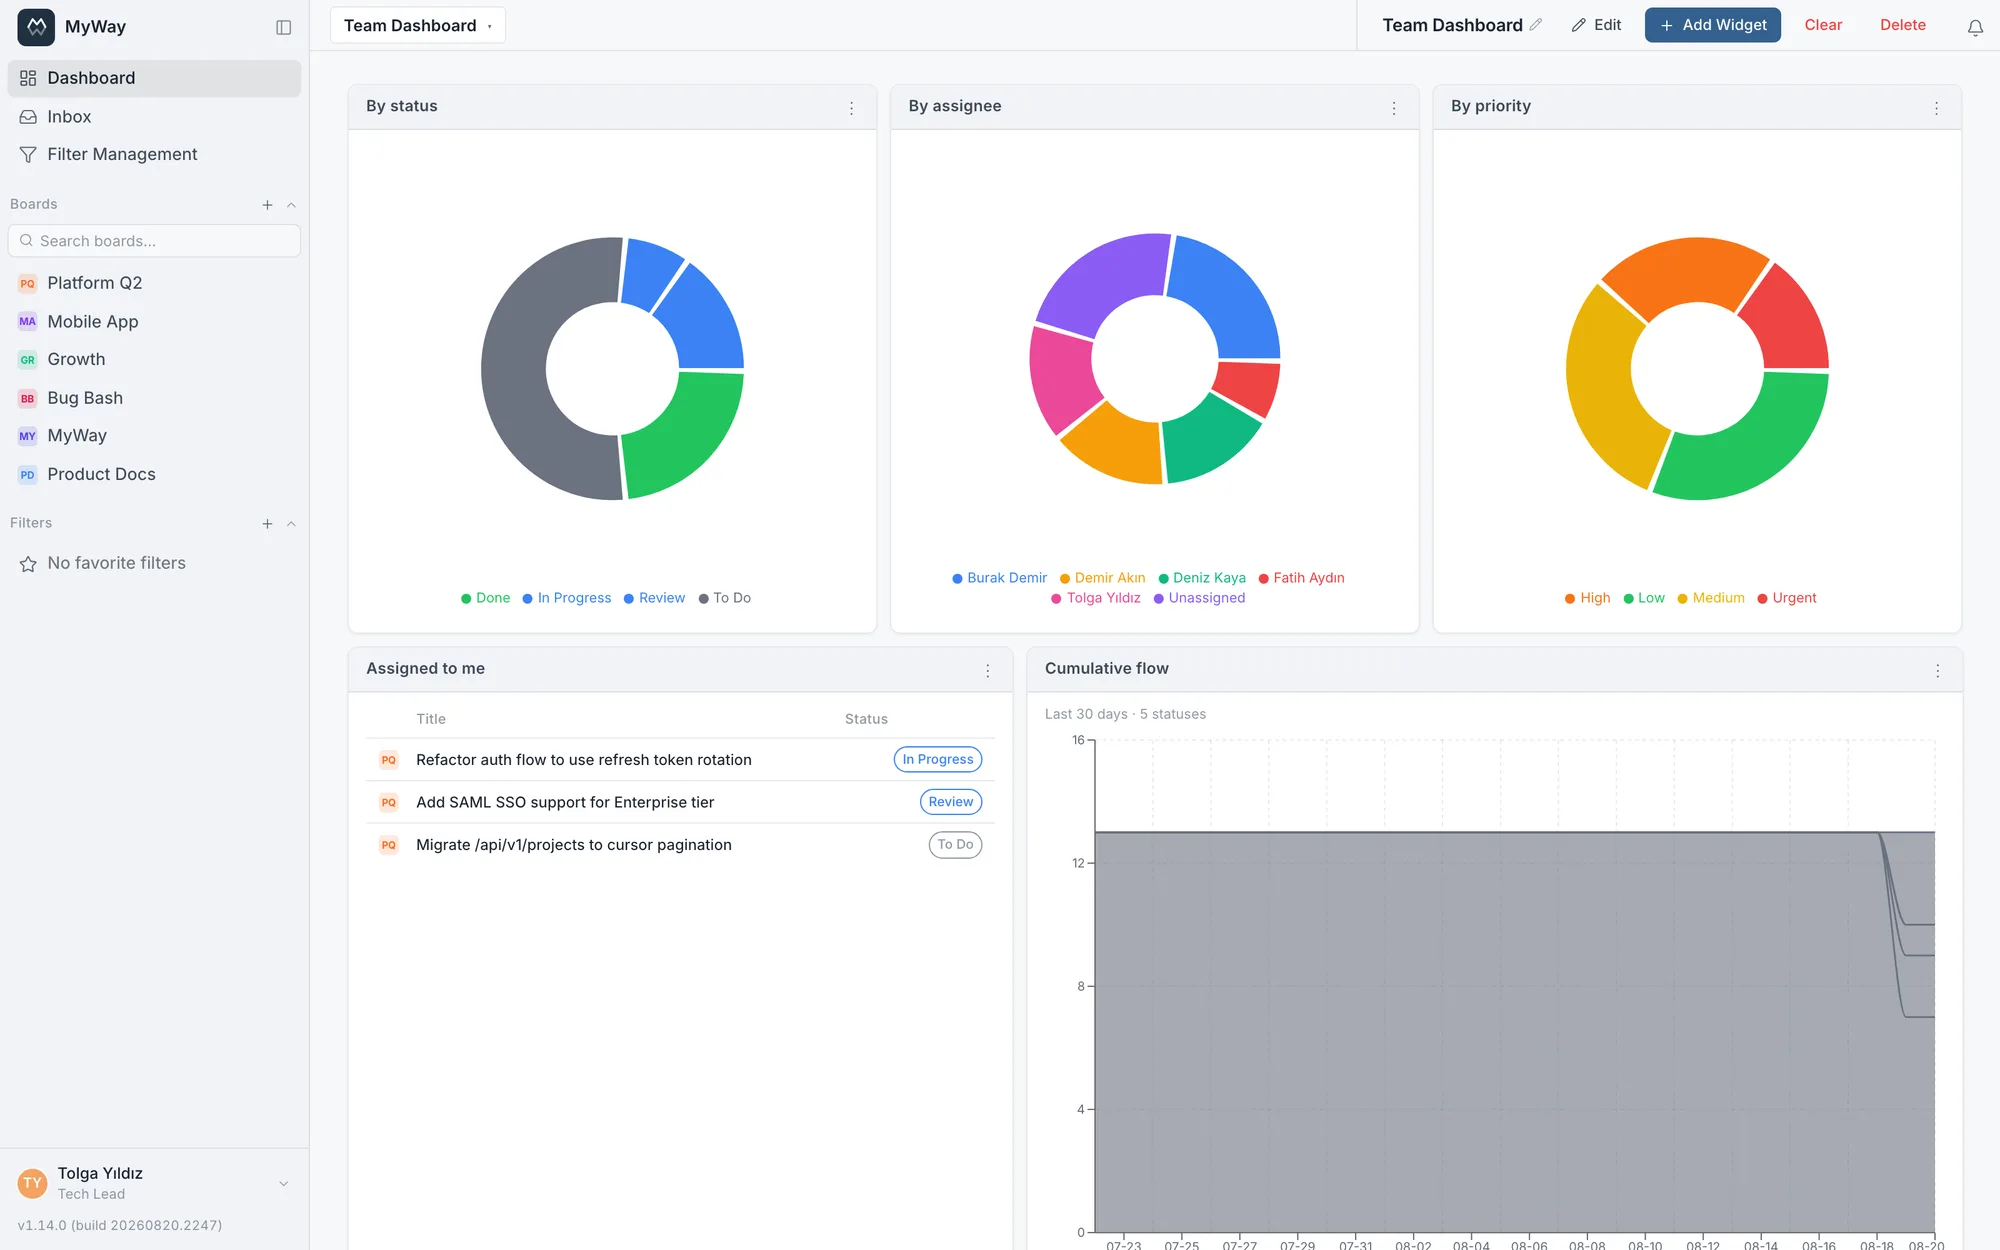
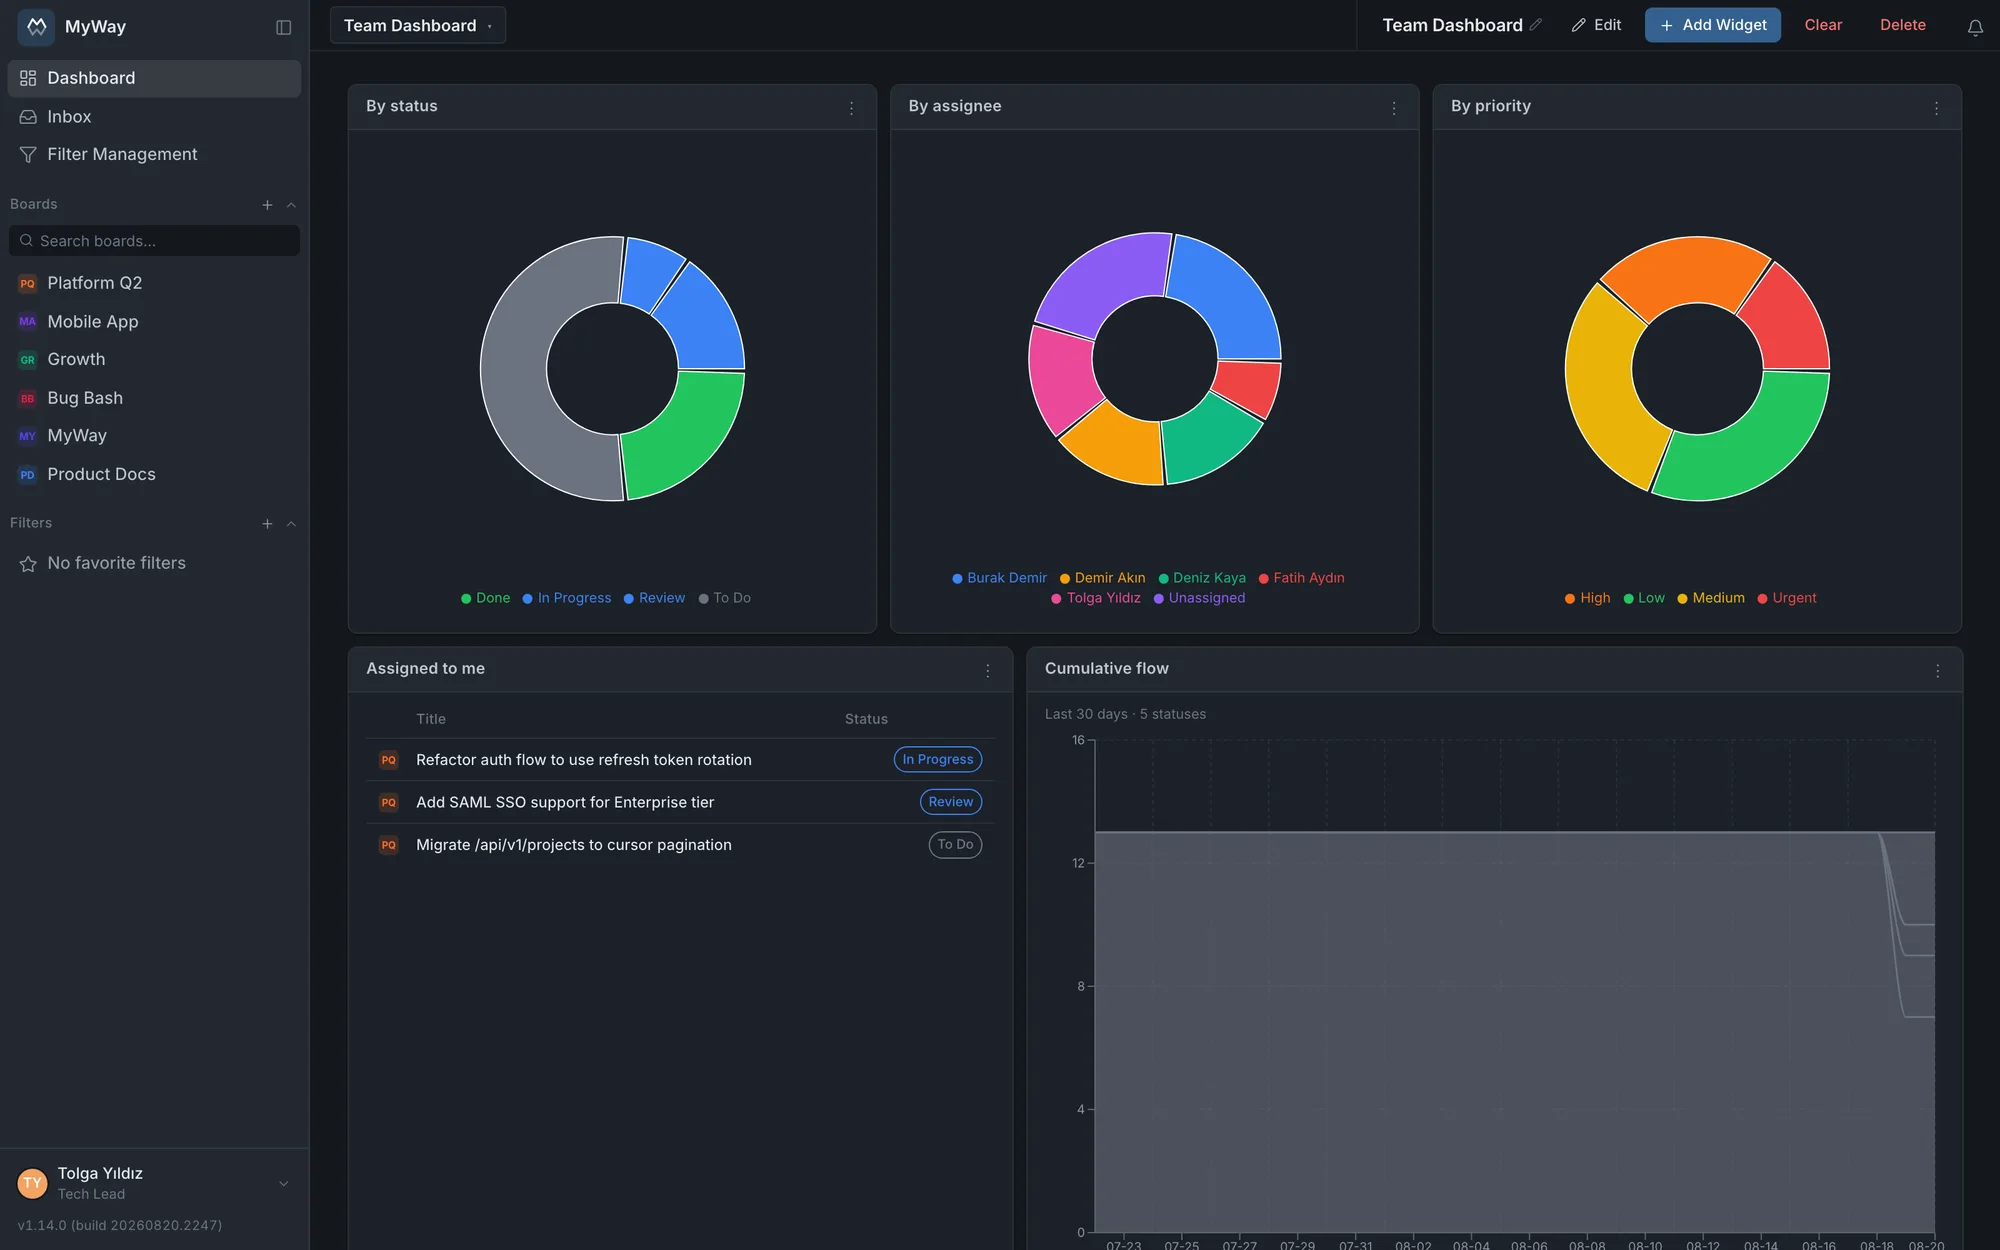
Personal dashboards are built with drag-and-drop widgets. Position and size widgets on a 12-column grid; each user builds their own dashboard. You can keep several dashboards as tabs, favourite them, and set one as the default that opens after login. You change the layout in edit mode and save it; "Reset Layout" puts cards back in their default positions. A dashboard holds up to 20 widgets.
- Most cards source a single board; the Saved Filter card sources a saved filter, My Issues covers all boards, Activity Stream one board or all boards, and Calendar, Cycle time and Status aging several boards you choose
- Clicking a slice in the status, assignee or priority distribution, or in Workload Distribution, opens that slice’s tasks filtered on the Filter Management screen
- Customize widget titles, row limits and the sort order on list cards
Widget types
There are fifteen widget types and the table lists every one; the names are the ones in the "Add Widget" dialog. Calendar, Sprint goal & completion and Cycle time arrived in v1.61.0, and the last one, Status aging, in v1.62.0.
| Widget | What it shows |
|---|---|
| My Issues | Unfinished tasks assigned to you across all boards. It shows title and status columns, with the board as a badge on each row; click the title or status header to sort. Up to 20 tasks are shown. |
| Saved Filter | The result of a saved filter you pick, as a list. Columns such as priority, due date, start date and estimate can be added; custom fields can be chosen as columns too, and when the filter looks at several boards or all boards, the custom fields of those boards are listed together. Person-type custom fields show the person’s name. Up to 50 rows per page, with paging and sortable columns. |
| Status Distribution | Breaks the tasks of the selected board down by status. |
| Assignee Distribution | How the task count is spread across people. |
| Workload Distribution | How work is spread across people, by one of three measures: task count, Story Points, or capacity utilization against the sprint’s capacity plan. Task count and Story Points are drawn as a donut or horizontal bars; capacity utilization only as horizontal bars (percentages do not split into a pie). Story Points go to the task’s first assignee. The card can be narrowed to a sprint: "All tasks (no sprint filter)", "Active sprint (automatic)" or a specific sprint, closed ones included. The top row shows total tasks, total points, unassigned work and the number of tasks without an estimate. The capacity measure needs the capacity plan of the chosen sprint, or of the active sprint if none is chosen, and does not work on boards without sprints; it adds capacity, remaining work and how many people are over capacity, and team members with no work appear too, so idle capacity is visible. |
| Priority Distribution | The priority mix of the board’s tasks, finished ones included; tasks without a priority get their own slice. |
| Burndown | Remaining work in the selected sprint, day by day; the active sprint by default. |
| Velocity | Planned and completed Story Points over the last N completed sprints (3 to 12, default 6). |
| Cumulative Flow (CFD) | How work accumulated across statuses over the last N days (between 3 and 90). The legend follows the status order in the workflow. |
| Activity Stream | The most recent changes in time order. The source can be a single board or all boards. |
| Comment Heatmap | Daily comment volume on the selected board. It has month and day labels and a "3 months / 6 months / 1 year" range picker; click a day to list which task got how many comments and jump straight to it. |
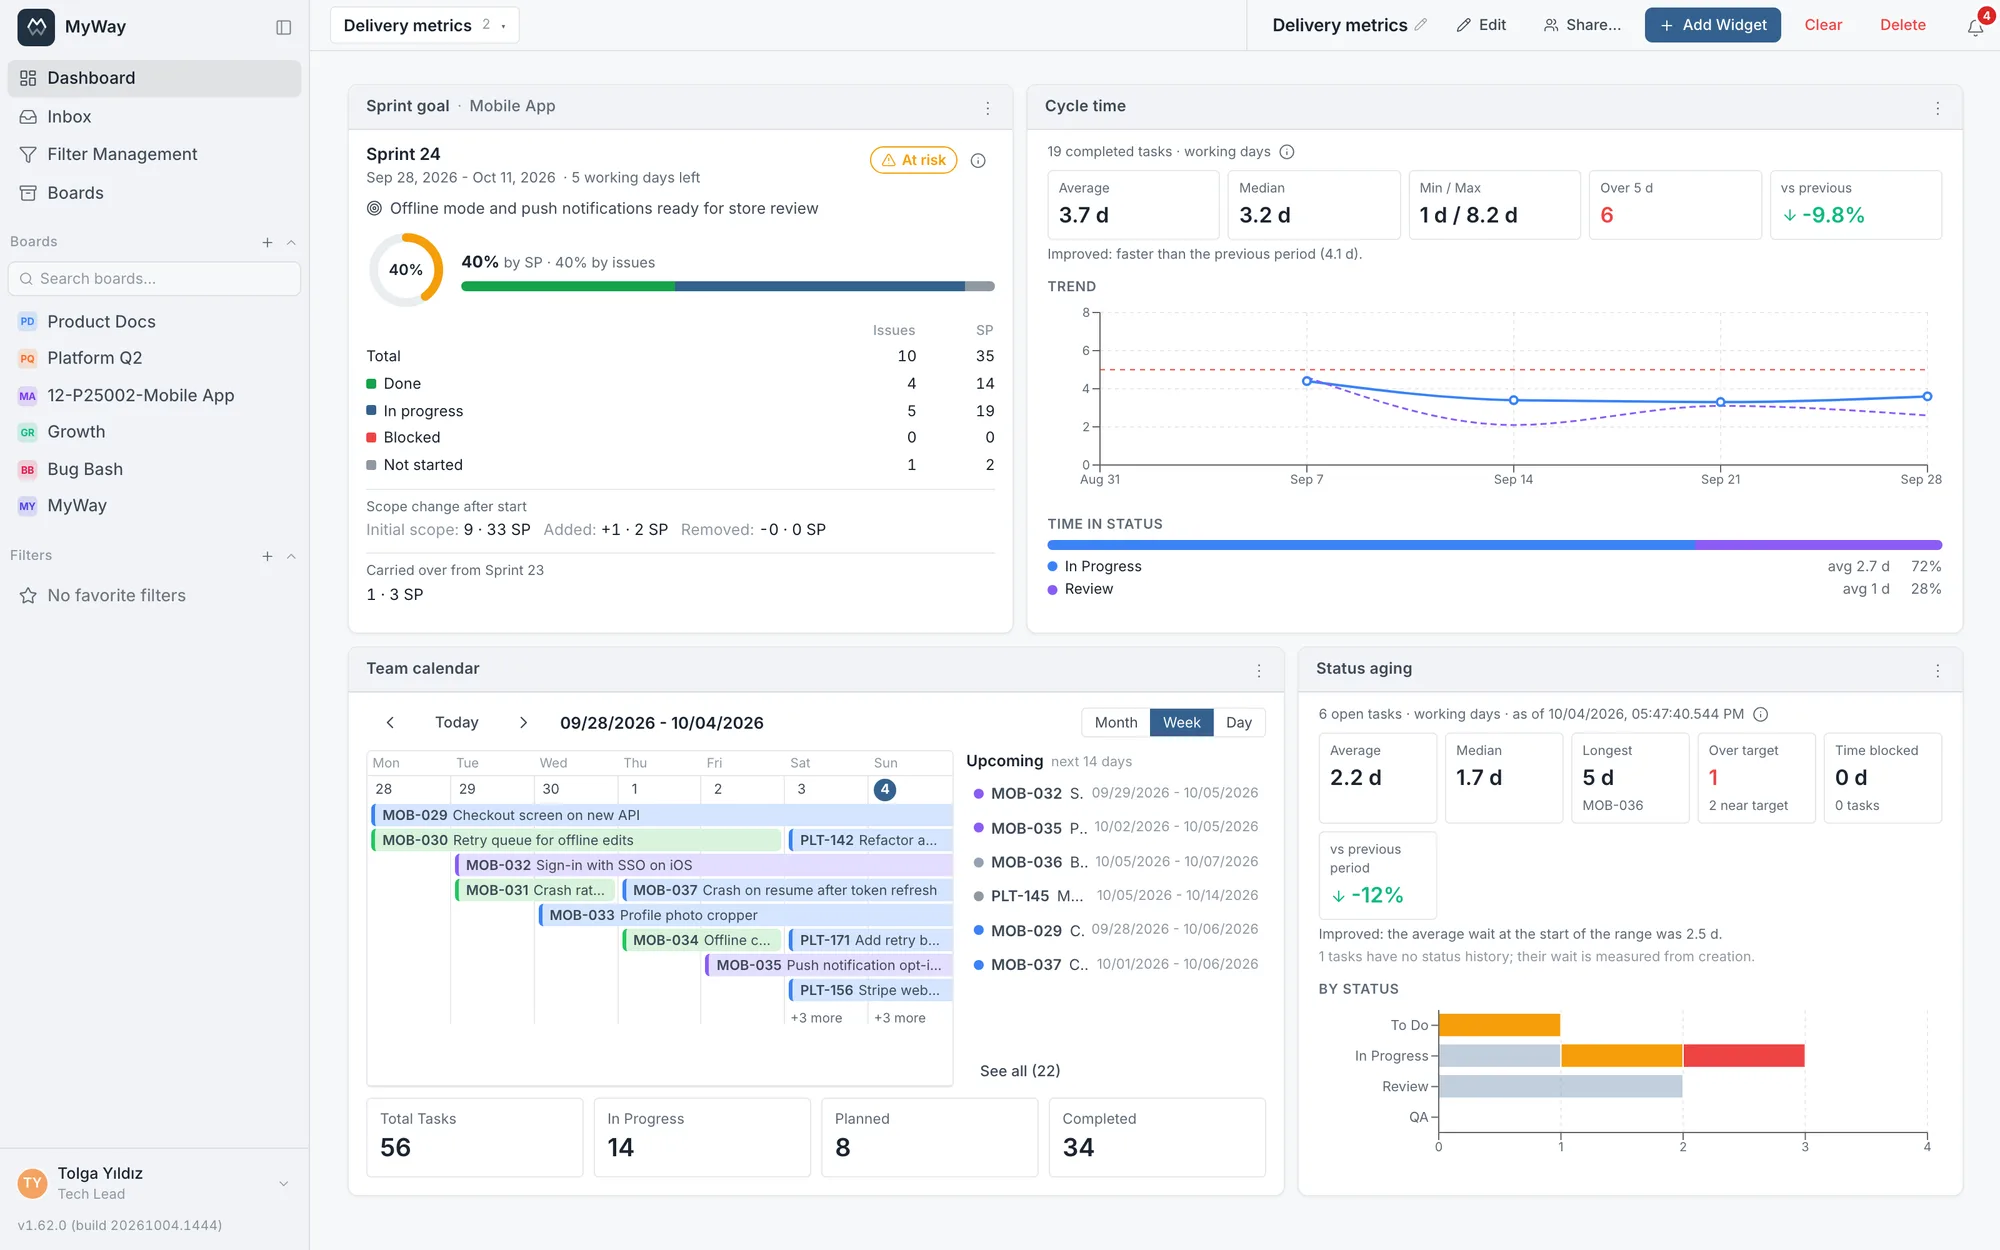
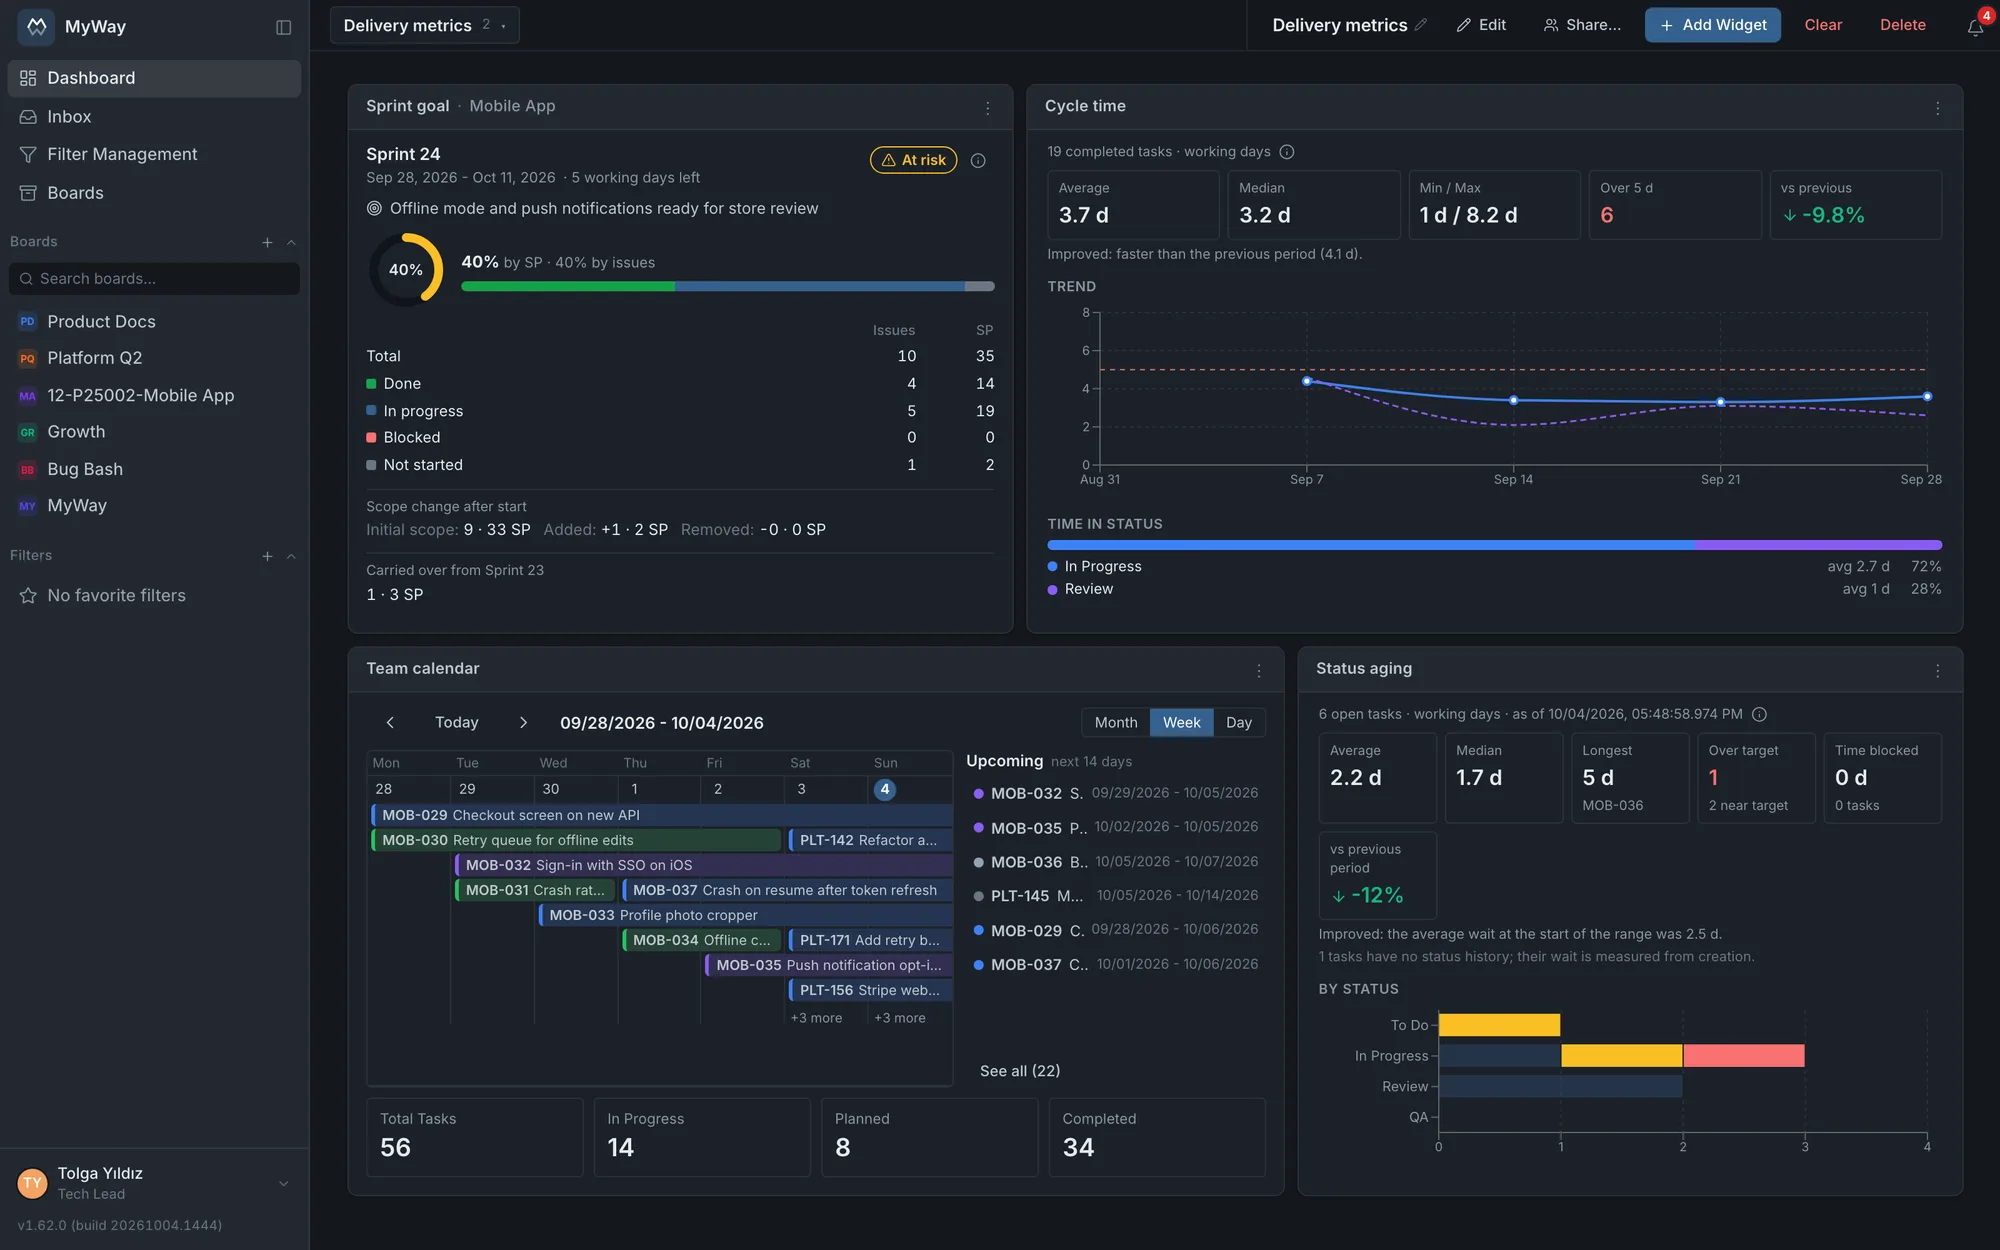
| Calendar | Tasks in month, week or day view, across several boards. For start and end you pick the built-in dates (start date, due date) or a date-type custom field on the board; the span between them is drawn as one continuous bar. Filter by status, assignee and label; with "Current user" as the assignee, everyone sees their own tasks on a shared dashboard. The filter applies to the calendar, the "Upcoming" list beside it (the next 14 days by default) and the Total Tasks / In Progress / Planned / Completed counts below. Click a count to open those tasks in a list. Tasks whose start is after their end are not drawn, and their number is shown as a warning. |
| Sprint goal & completion | The selected sprint’s goal (the board’s active sprint by default), its date range and completion rate; the main metric is issue count or Story Points. Extra metrics switch on and off one by one: status breakdown, remaining working days per the board calendar, scope added and removed after the start, and work carried over from the previous sprint. A badge at the top states the sprint’s status: On track, At risk, Late or Done. The card spells out the "At risk" rules: remaining work that does not fit the recent sprints’ velocity, completion lagging behind the days used, part of the open work being blocked, or scope growing after the start. It does not work on boards without sprints. |
| Cycle time | The time from starting work on a task to finishing it, on one or several boards you choose. Average, median, min and max, the number of tasks over target, and the change against the previous period of the same length (improved or worsened); below that a trend by day, week, month or sprint, time in status and the longest tasks. By default it measures from the task entering an In progress status to entering a Done status; you can set the start and end statuses, the date range (last N days or a custom range), a target in days, calendar or working days, and how reopened tasks count. Each task’s calculation can be opened on its own, and the average cycle time in the board header uses the same calculation. |
| Status aging | How long open tasks have been waiting in their current status, on one or several boards you choose (up to 20). At the top: average, median and longest wait, the number of tasks over target (with how many are near target), time blocked, and the change against the snapshot at the start of the range; below that a per-status table and the 10 longest-waiting tasks. The per-status view is horizontal bars, a heatmap or a distribution table, and splits tasks into age buckets (by default 0-1, 2-3, 4-7, 8-14 and 15+ days; up to 8 bounds can be entered). Each status takes its own target in days, and a status without one uses the default target; a task reaching the warning threshold (80% of the target by default) shows in the "near target" colour, one past the target in the "over target" colour. If no tracked statuses are picked, all open statuses are tracked; same-named statuses on different boards are combined into one row. Durations are calendar days or working days per each board’s work calendar; for a task that re-entered its status, the wait counts from the last entry (the default) or as the total time spent in the status. The wait is measured at the end of the chosen date range (the last 30 days by default) and the change is compared with the snapshot at its start; the comparison can be switched off. Completed and canceled tasks are left out by default and can be included when they finished within the range. Time blocked is time spent in statuses named like Blocked plus time with an open blocker linked. Filter by sprint, assignee, issue type, priority and label. Clicking a count, bar or cell opens those tasks on the Filter Management screen (up to 1000 tasks); clicking one of the longest-waiting tasks shows when it entered the status, its wait, target and time blocked. |
Sharing
You can share a dashboard with people or groups (up to 50 people and 50 groups) through "Share...". A shared dashboard opens read-only for the recipient and appears under “Shared with You” in their list. Anyone who wants changes makes a copy, so two people cannot edit the same layout and overwrite each other. Card data does not widen with sharing: where the recipient has no access to a board, the card says "You do not have access to this card’s board" instead of showing data. Dashboards that belong to someone else show their owner’s name in the list.
The workspace default
The superadmin can see every dashboard with "Show all dashboards in the workspace (superadmin)"; the list shows each one with its owner’s name, so same-named dashboards can be told apart. They can delete one that belongs to someone else and mark one with "Make workspace default". A dashboard marked this way is shared automatically with every new sign-up and becomes their personal default: a new hire’s first day starts with the dashboard the team prepared rather than a blank screen.